Bye Bye Moore

PoCソルジャーな零細事業主が作業メモを残すブログ

【読書メモ】ROS2ではじめよう 次世代ロボットプログラミング

ROS2ではじめよう 次世代ロボットプログラミング

ROS2ではじめよう 次世代ロボットプログラミング

前のROS conでも盛り上がったロボット向けミドルウェアROS2の数少ない教本です。

一応、英語なら別のがあるのですが……この英語本はあまり親切ではないです。
どっかのWEB教材を本にしたみたいで。


ROS2は旧バージョンと比較して構造がスマートになり、
実業界で求められるリアルタイム性が大きく向上したとのこと。
一応、旧ROSのライブラリを活かすパッケージはありますが実質別物と考えた方がいいようで。
この関係性はPython2とPython3に似てますね。

X WindowはUbuntuでも使える

shuzo-kino.hateblo.jp
ではRasPiでやっていましたが、VirtualBox上のUbuntuでも当然同じことができます。

実際のところ

$ ssh -X -C user@localhost -p 2222
encrobot@localhost's password: 
Welcome to Ubuntu 18.04.3 LTS (GNU/Linux 5.0.0-36-generic x86_64)
(ry

user@encrobot-VirtualBox:~$

これでやると、matplotlibのような結果をレンダリングするスクリプトも一々画面を開かずにすみます。
shuzo-kino.hateblo.jp

参考もと

e-words.jp

matplotlibでキーアクションを受け取る

インタラクティブ編その2、キーボードの入力を受け取るやつです。
Arduinoなど外部機器を擬似キーボードとして繋げばグラフの切り替えなんかで楽できますね。

実際のところ

import sys
import numpy as np
import matplotlib.pyplot as plt


def press(event):
    print('press', event.key)
    sys.stdout.flush()
    if event.key == 'x':
        visible = xl.get_visible()
        xl.set_visible(not visible)
        fig.canvas.draw()

# Fixing random state for reproducibility
np.random.seed(19680801)


fig, ax = plt.subplots()

fig.canvas.mpl_connect('key_press_event', press)

ax.plot(np.random.rand(12), np.random.rand(12), 'go')
xl = ax.set_xlabel('easy come, easy go')
ax.set_title('Press a key')
plt.show()

f:id:shuzo_kino:20191129003807p:plain

$ python 002.py 
libGL error: No matching fbConfigs or visuals found
libGL error: failed to load driver: swrast
press u
press i

軸の位置をオフセットさせる

ヒートマップやタイル状に敷き詰めるようなサンプルの場合、
軸が全く見えず困ることがあります。
幸い、matplotlibにも軸をオフセットさせるオプションが用意されています。

実際のところ

"""
==============
Dropped spines
==============

Demo of spines offset from the axes (a.k.a. "dropped spines").
"""
import numpy as np
import matplotlib.pyplot as plt


fig, ax = plt.subplots()

image = np.random.uniform(size=(10, 10))
ax.imshow(image, cmap=plt.cm.gray, interpolation='nearest')
ax.set_title('dropped spines')

# Move left and bottom spines outward by 10 points
ax.spines['left'].set_position(('outward', 10))
ax.spines['bottom'].set_position(('outward', 10))
# Hide the right and top spines
ax.spines['right'].set_visible(False)
ax.spines['top'].set_visible(False)
# Only show ticks on the left and bottom spines
ax.yaxis.set_ticks_position('left')
ax.xaxis.set_ticks_position('bottom')

plt.show()

初期レンダリングは変哲のないタイル状ですが

十字矢印を動かすと、スケール間で動きます。

matplotlib でスライダーを

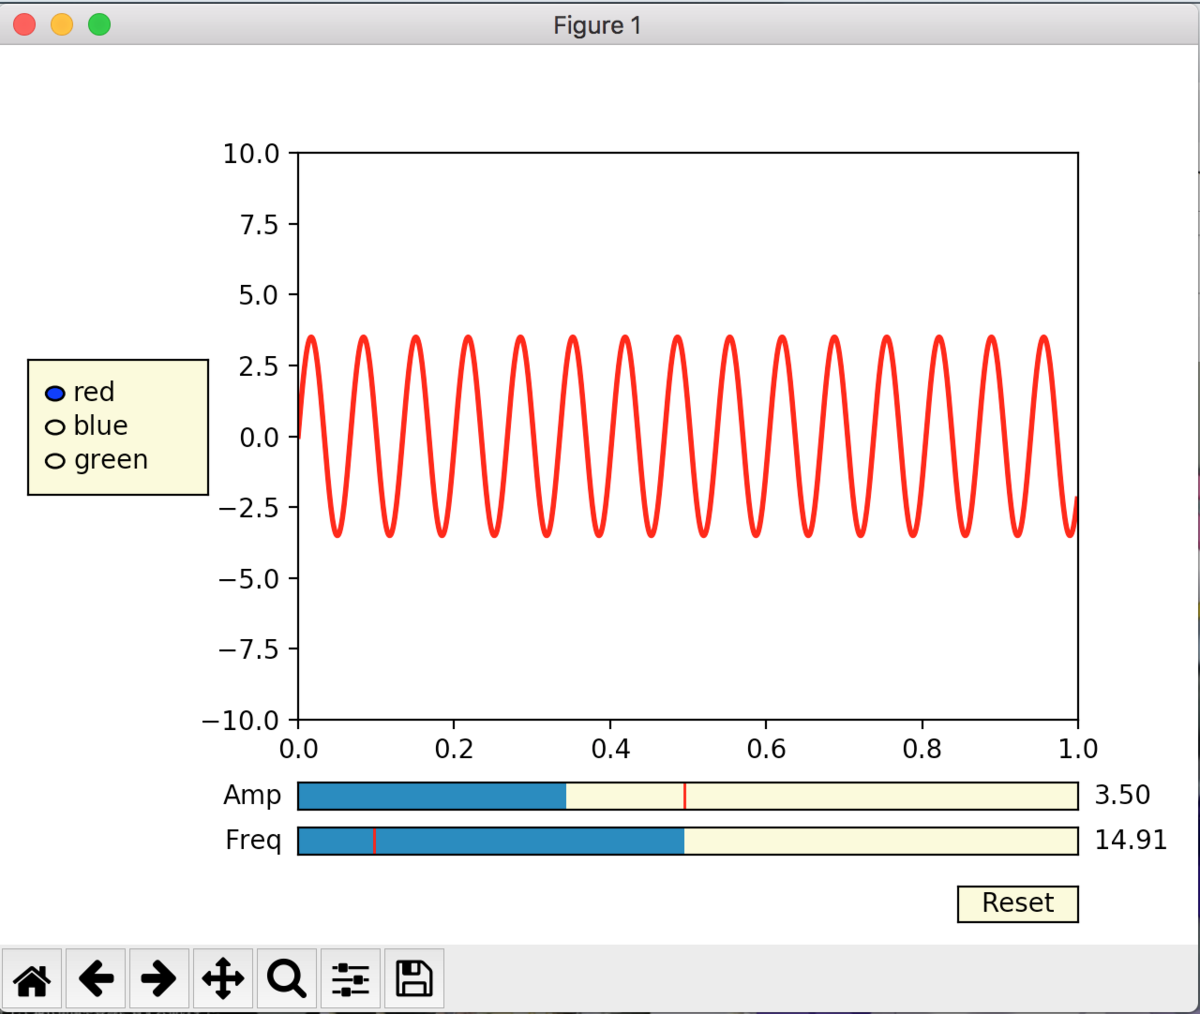
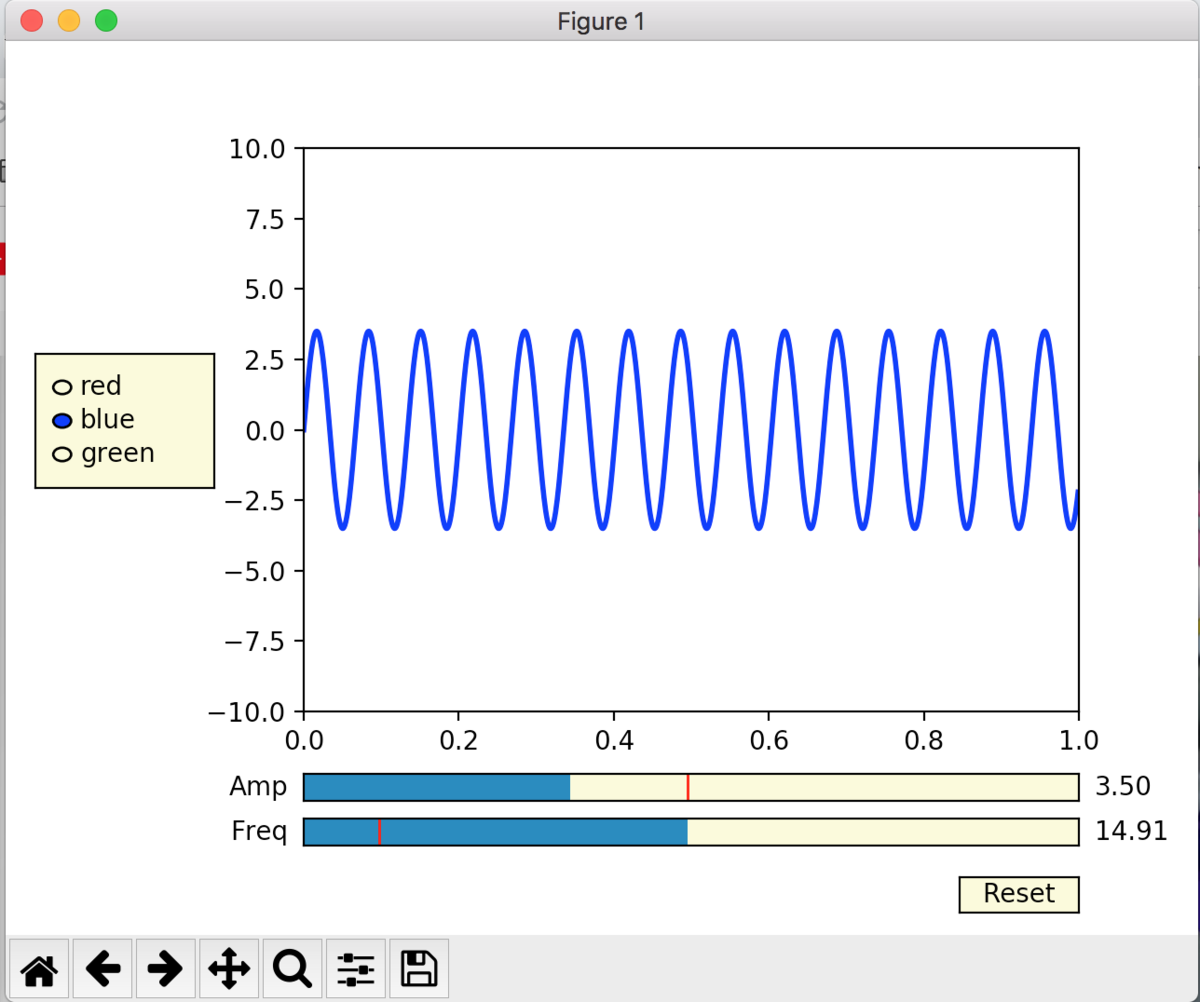
matplotlibにはスライダーUIが付いてます。
値をインタラクティブに変更したい事例で使えますね。

実際のところ

python

import numpy as np
import matplotlib.pyplot as plt
from matplotlib.widgets import Slider, Button, RadioButtons

fig, ax = plt.subplots()
plt.subplots_adjust(left=0.25, bottom=0.25)
t = np.arange(0.0, 1.0, 0.001)
a0 = 5
f0 = 3
s = a0*np.sin(2*np.pi*f0*t)
l, = plt.plot(t, s, lw=2, color='red')
plt.axis([0, 1, -10, 10])

axcolor = 'lightgoldenrodyellow'
axfreq = plt.axes([0.25, 0.1, 0.65, 0.03], facecolor=axcolor)
axamp = plt.axes([0.25, 0.15, 0.65, 0.03], facecolor=axcolor)

sfreq = Slider(axfreq, 'Freq', 0.1, 30.0, valinit=f0)
samp = Slider(axamp, 'Amp', 0.1, 10.0, valinit=a0)


def update(val):
    amp = samp.val
    freq = sfreq.val
    l.set_ydata(amp*np.sin(2*np.pi*freq*t))
    fig.canvas.draw_idle()
sfreq.on_changed(update)
samp.on_changed(update)

resetax = plt.axes([0.8, 0.025, 0.1, 0.04])
button = Button(resetax, 'Reset', color=axcolor, hovercolor='0.975')


def reset(event):
    sfreq.reset()
    samp.reset()
button.on_clicked(reset)

rax = plt.axes([0.025, 0.5, 0.15, 0.15], facecolor=axcolor)
radio = RadioButtons(rax, ('red', 'blue', 'green'), active=0)


def colorfunc(label):
    l.set_color(label)
    fig.canvas.draw_idle()
radio.on_clicked(colorfunc)

plt.show()

f:id:shuzo_kino:20191128003721p:plain

f:id:shuzo_kino:20191128003727p:plain

f:id:shuzo_kino:20191128003731p:plain

Hy環境からグラフ描画環境matplotlibを使う

matplotlibはnumpyと合わせて使われる事も多い、
グラフ描画ライブラリです。
qiitaの記事は5000件超、最新で使われてる事例もここ一ヶ月で複数個あるので
使われているライブラリと言っていいでしょう。
今回は、これをHylang経由で使って見ます。

実際のところ

python

"""
=======================================
A simple plot with a custom dashed line
=======================================

A Line object's ``set_dashes`` method allows you to specify dashes with
a series of on/off lengths (in points).
"""
import numpy as np
import matplotlib.pyplot as plt


x = np.linspace(0, 10, 500)
dashes = [10, 5, 100, 5]  # 10 points on, 5 off, 100 on, 5 off

fig, ax = plt.subplots()
line1, = ax.plot(x, np.sin(x), '--', linewidth=2,
                 label='Dashes set retroactively')
line1.set_dashes(dashes)

line2, = ax.plot(x, -1 * np.sin(x), dashes=[30, 5, 10, 5],
                 label='Dashes set proactively')

ax.legend(loc='lower right')
plt.show()

f:id:shuzo_kino:20191128004109p:plain