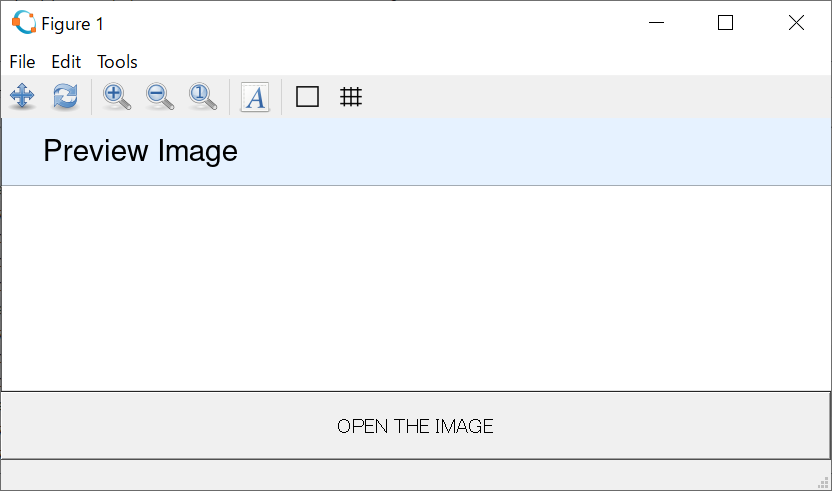
GNU octaveでプロット結果にボタンやスライドバーつけるならuicontrol
ある計測結果をプロットしたけど、少し条件を変えてもみたい
でも少し値弄ってレンダリングし直すのも何か違う
欲を言えば、客先でデモもできれば理想……そういう時はuicontrolで色々設定可能です
実際のところ
%% In file 'imageViewer.m'
function imageViewer ()
  MainFrm = figure ( ...
    'position', [100, 100, 250, 350]);

  TitleFrm = axes ( ...
    'position', [0, 0.8, 1, 0.2], ...
    'color',    [0.9, 0.95, 1], ...
    'xtick',    [], ...
    'ytick',    [], ...
    'xlim',     [0, 1], ...
    'ylim',     [0, 1] );

  Title = text (0.05, 0.5, 'Preview Image', 'fontsize', 30);

  ImgFrm = axes ( ...
    'position', [0, 0.2, 1, 0.6], ...
    'xtick',    [], ...
    'ytick',    [], ...
    'xlim',     [0, 1], ...
    'ylim',     [0, 1]);

  ButtonFrm = uicontrol (MainFrm, ...
    'style',    'pushbutton', ...
    'string',   'OPEN THE IMAGE', ...
    'units',    'normalized', ...
    'position', [0, 0, 1, 0.2], ...
    'callback', { @previewImage, ImgFrm });
end

%% callback subfunction (in same file)
function previewImage (hObject, eventdata, ImageFrame)
  [fname, fpath] = uigetfile();
  Img = imread (fullfile(fpath, fname));
  axes(ImageFrame);
  imshow(Img, []);
  axis image off
end
実行するには
imageViewer ();
